
When it comes to presenting documents, visual elements such as charts and graphs help us understand the data quicker and better. Whether it’s for an academic report or a work presentation, the use of charts has become a regular occurrence. Thus, it’s no wonder that platforms like Google Docs have made inserting and editing charts a breeze.

We’ll show you different ways to insert, edit, and customize charts and graphs in Google Docs. So, let’s get started.
How to Insert Charts in Google Docs
Google Docs offers a couple of ways through which you can insert a chart. You can either import one from Google Sheets or create a new one from scratch and edit it later. Here’s how they work.
Step 1: Open up your Google Docs document.
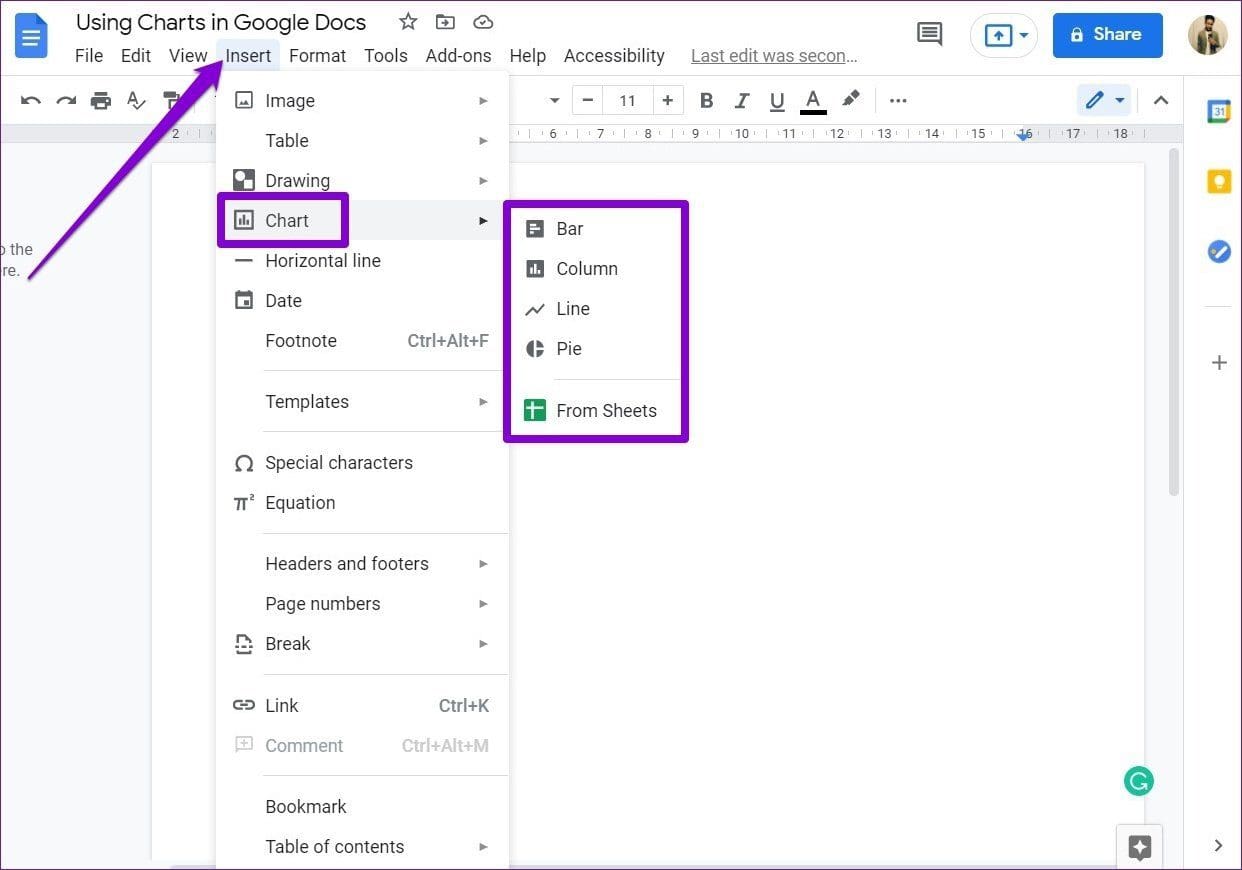
Step 2: Use the Insert menu at the top to navigate to Chart and select a chart type (Bar, Column, Line, or Pie) that you wish to use in your Google Docs document.
Alternatively, you can also import a chart from any of your existing spreadsheets in Google Sheets. Here’s how.
Step 1: Open your Google Docs document and navigate to Insert > Charts > From Sheets.
Step 2: Here, you’ll see all the spreadsheets in your account. Select the spreadsheet from which you wish to import the chart.
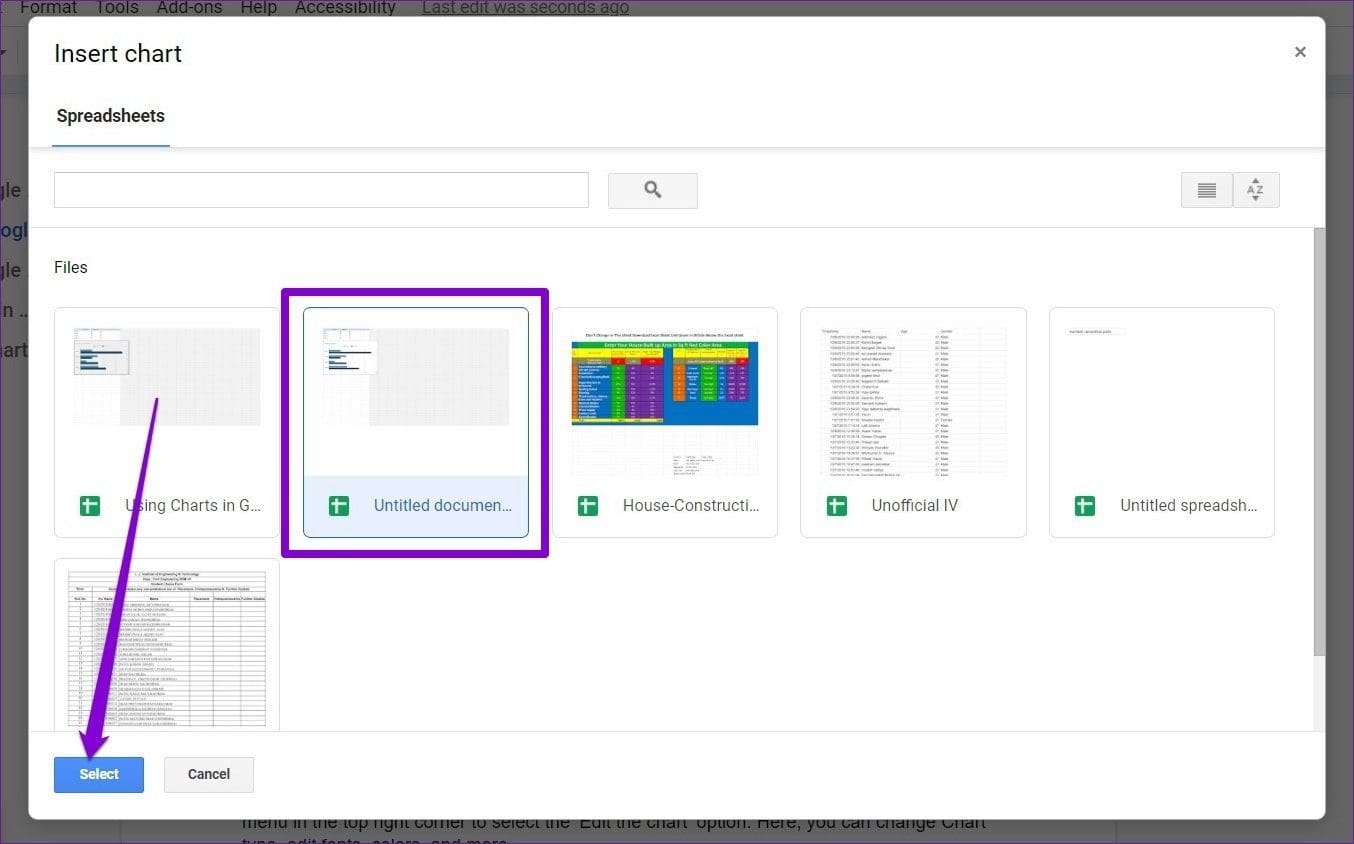
Step 3: Next, select all the charts from the spreadsheet that you wish to add. If you don’t want the chart to be linked to the spreadsheet, uncheck the ‘Link to spreadsheet’ option. Lastly, click on Import.

And that’s about it. You’ll now see your chart in your Google Docs document. From there, you can move, resize, and position the chart just like an image in Google Docs.
How to Edit Charts in Google Docs
After inserting the chart in your document, you’ll notice that Google Docs doesn’t let you edit the chart by clicking on it. For that, you’ll have to open it in Google Sheets. Here’s how.
Step 1: Select your chart in Google Docs. Now use the downward arrow in the top right to select Open source.

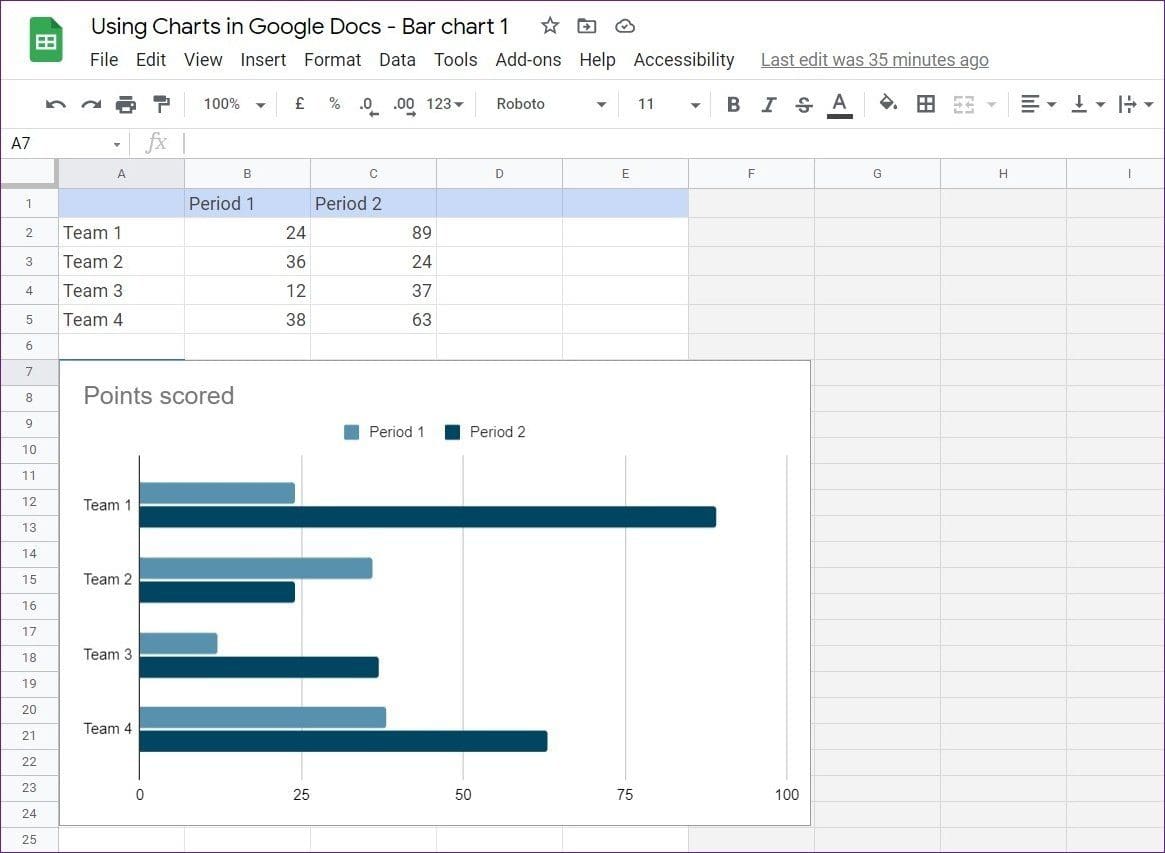
Step 2: A Google Sheet will open in a new tab with the chart’s data. Use the cells above the chart to edit the data as per your requirements and the chart will be updated accordingly.
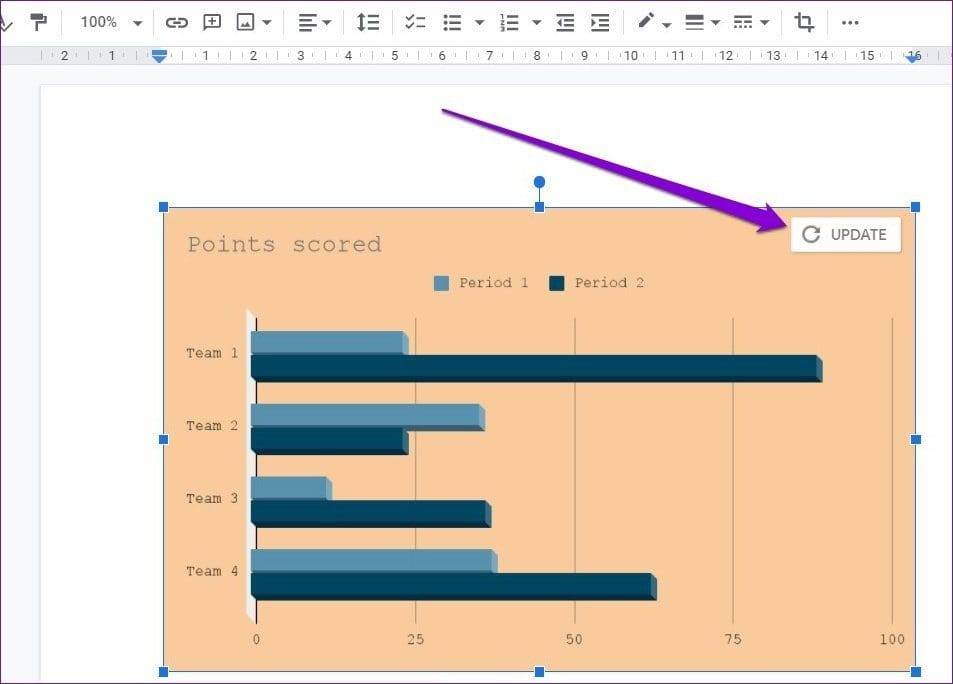
Step 3: After making all the changes, go back to your Google Docs document, select your chart and click on the Update button that appears at the top.
Easy, right? Now that you know how to insert and edit the chart, let’s see how you can customize your chart in Google Docs.
How to Customize Charts in Google Docs
While Google Docs doesn’t let you edit data directly, it does, however, offer a few customization options that you can use to change the look and feel of the chart. Here’s how to do it.
Step 1: Open up your Google Docs document and select the chart you wish to customize.
Step 2: Use the three-dot menu from the toolbar below the chart and choose All image options.

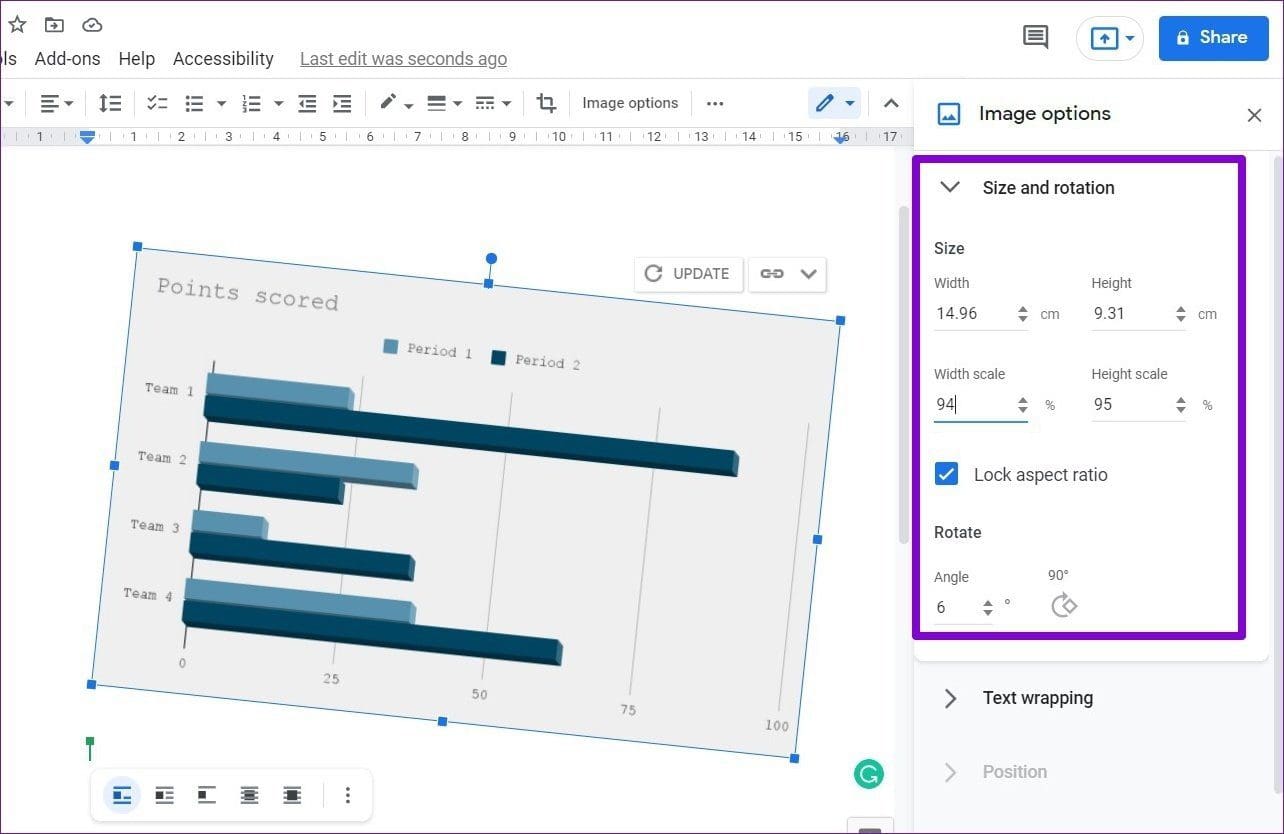
On your right, an Image options menu will appear. Under Size and rotation, you can edit the width and the height of the chart and rotate it.
Similarly, you can add more colors to your chart by picking from the available combinations under Re-colour.

Lastly, under Adjustment, you can tweak other aspects of the chart such as Transparency, Brightness, and Contrast.

Once you’re done with the changes click on the X in the top right corner to close Image options menu.
How to Unlink or Delete Charts in Google Docs
By default, your Google Docs chart is linked to its source spreadsheet. Any changes you make in the spreadsheet can be applied to the chart with a single click. However, if you’re satisfied with your chart as it is and do not wish to update your chart anymore, Google Docs also allows you to unlink the chart from its source spreadsheet. Here’s how.
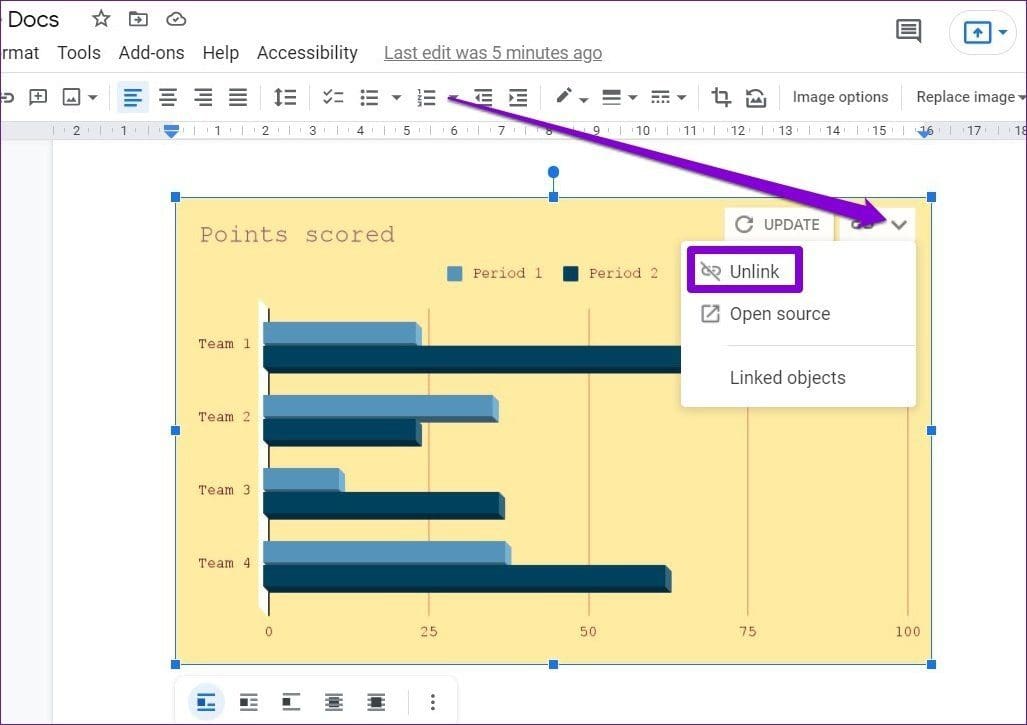
To unlink a chart, select the chart and use the downward arrow menu in the top right to choose the Unlink option.
Similarly, if you wish to remove a chart from your Google Docs document, right-click on it, and select choose the Delete option.

You can also select the chart and press the Delete key on your keyboard.
Data At Glance
Google Docs sure does make using charts and graphs easier. That said, Google Docs only allows using charts in its web version, and we hope that it soon brings the same functionality to its mobile app.


